


German consumption of meat, dairy, fat and sugar are clearly above dietary recommendations, while fruits, vegetables, and legumes are below recommended amounts. Supporting the dietary changes needed to meet these recommendations would not only provide major health benefits, but also lower the environmental impacts associated with food production, particularly in relation to climate change. For the bioeconomy, ensuring safe, secure and healthy diets for all represents one key pillar of the envisioned socio-ecological transformation. It is also one avenue for citizens to engage and participate in the transformation. This goes beyond consumed amounts and also involves food choices prioritizing organic, regional and less processed foods (see BMLEH 2025 on these trends).
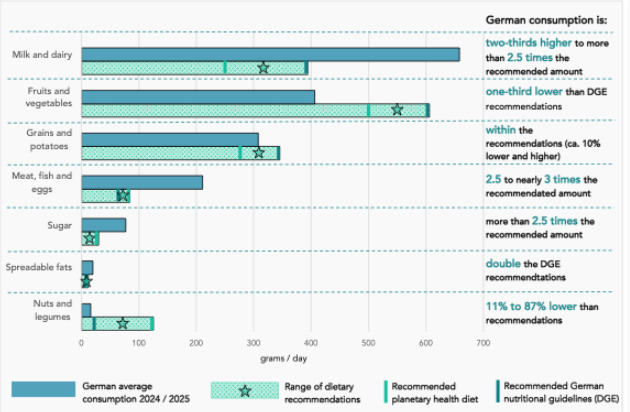
Average German consumption of food groups in 2024/25 compared to dietary recommendations
Source: Consumption data are derived from BMLEH (2025), using food waste reduction factors from Helander et al. (2021) for all food groups except meat, for which data is based on BLE (2026). Dietary recommendations are based on DGE (2024), as derived from Schäfer et al. (2024), and the Planetary Health Diet from Willett et al. (2019)
Meat consumption has rebounded in recent years. After a decade of decreasing or relatively steady consumption levels, the last four years (since reaching a low in 2022) show an increasing trend, especially as regards poultry.
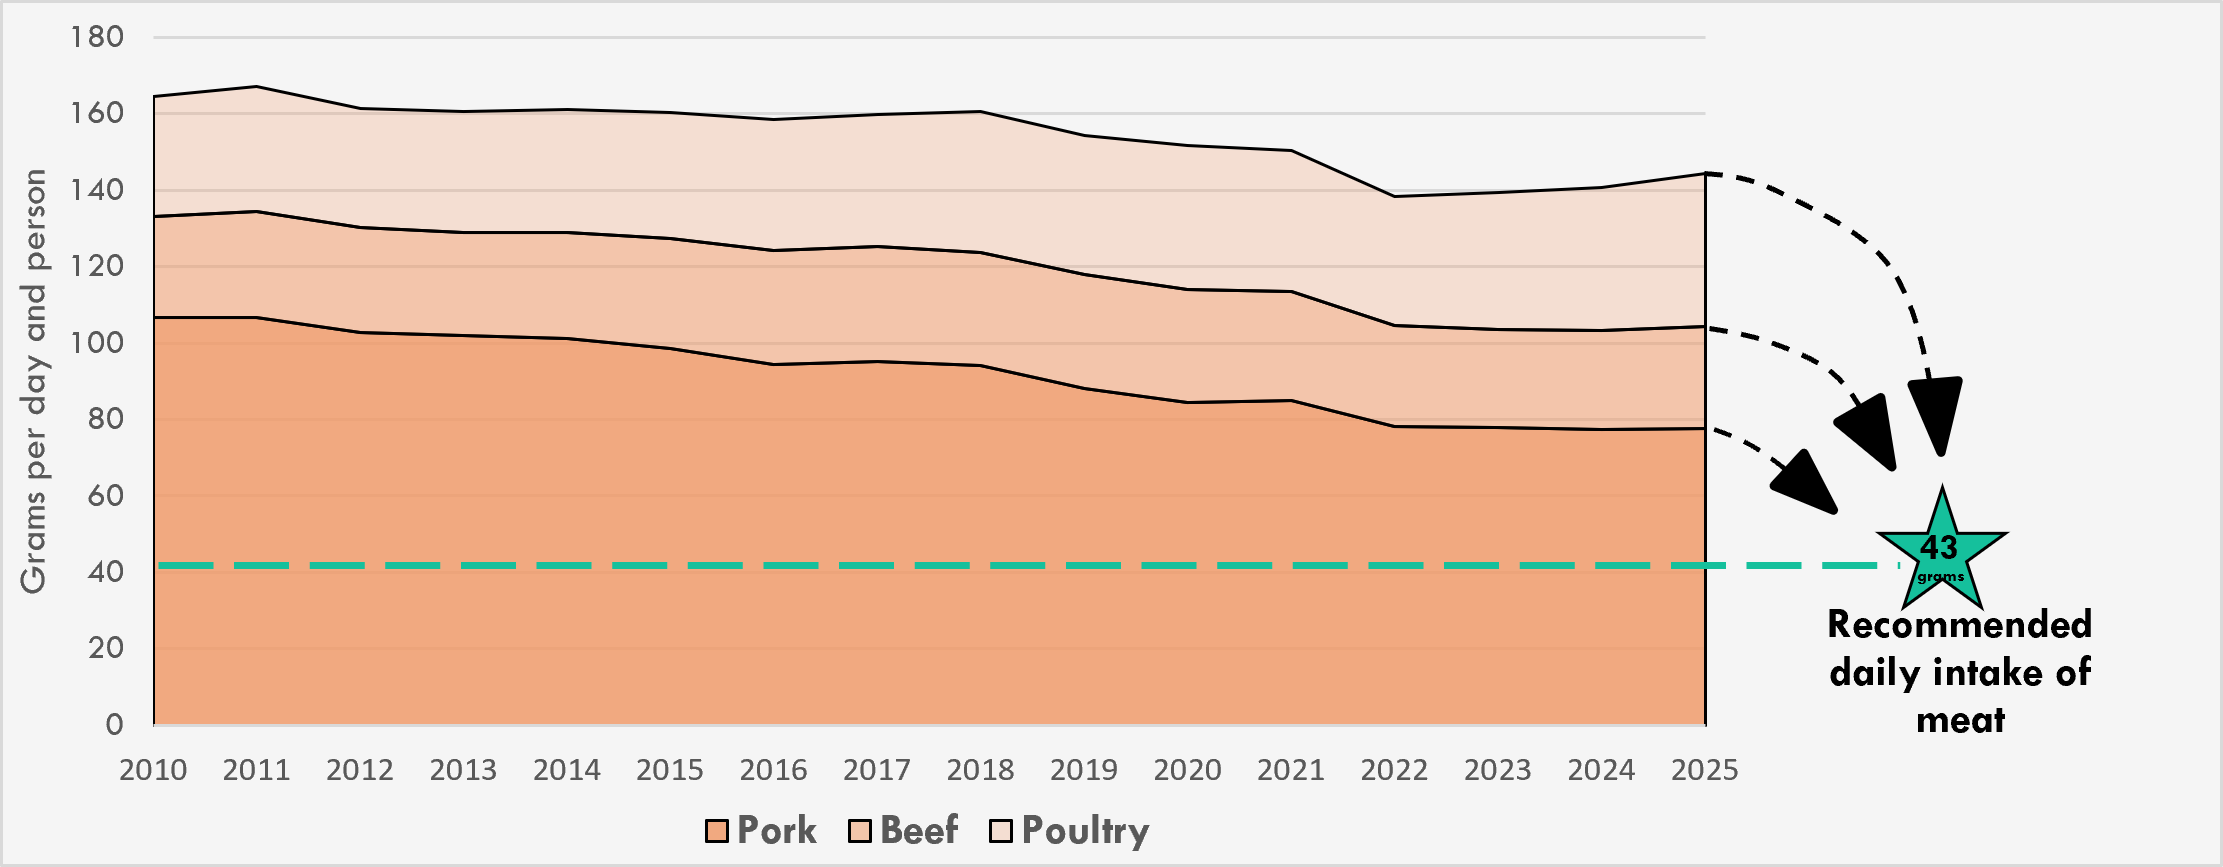
Trends in German meat consumption (pork, beef and poultry), 2010-2025
Source: Based on data on consumption from BLE (2026) and recommendations from DGE (2024)
This trend presents a contrast to self-reported changes in dietary habits. According to the annual survey "How Germany Eats" (BMLEH 2025), 37% of respondents reported consuming a flexitarian diet in 2025 (sometimes eating meat, but mostly consciously deciding for alternatives). The number of people eating meat on a daily basis sank from 34% in 2015 to 23% in 2024 (BMLEH 2025).
The figure depicts data based on a statistical method that accounts for annual meat supply and uses conversion factors to estimate average intake levels. This could imply that there is a divergence between people's perceived food habits and their actual practices. It could also reflect methodological differences underpinning the data, highlighting the need to continue collecting, maintaining, cross-checking and improving data from multiple sources. This is particularly relevant as regards the comparison to dietary recommendations.
Altogether, German meat consumption levels remain clearly above recommended amounts, with significant potential for improved health and lower environmental burden through dietary change. An estimated 144 grams were consumed per day and person in 2025, which is more than 3.3 times higher than the recommended daily intake of 43 grams (300 grams per week) by the German Nutrition Society (DGE 2024). Modelling of a "what-if" scenario showed that the German land footprint could be reduced by 14% and the climate footprint by 17%, if dietary recommendations were met by 2050 (Beck-O'Brien 2024).
Indicator profile
A.1 Policy relevance
The "Food and Nutrition Strategy" for Germany (adopted in 2024) emphasizes that food is central to good health and well-being, and food choices can either reduce or increase pressures on the environment and climate. Dietary behaviour changes – due, for example, to increasing food prices or changes in supply – need to be monitored in order to help identify potential risks to food security. Policy makers need information on the nutritional situation of the population to identify and respond to critical trends in a timely manner and to support policy priorities and the development of measures promoting healthy and safe diets.
For bioeconomy monitoring, indicators on dietary change can provide insights into both the composition of diets across different food groups and trends in the consumption of specific products. Future indicators may focus especially on meat and milk intake, highlighting key variables of social change, and complementing the ongoing food waste monitoring at national and international levels. For example, meat consumption in Germany well exceeds dietary recommendations. The 2024 Bioeconomy Monitoring Report showed that it was at least 3 times higher than recommended in 2022 and the updated data (2025) reflect this overshoot. . This is both associated with adverse health impacts as well high levels of resource use (in particular land and water) and climate emissions. Scenarios presented in the 2024 Bioeconomy Monitoring Report showed that the agricultural biomass footprint could be reduced by 13 %, the agricultural land footprint by 14 % and the climate footprint by 17 % compared to a reference scenario in 2050, if dietary recommendations for meat consumption by 2050 were met. This makes reducing meat consumption one key strategy to reduce Germany's pressures on natural resources, potentially creating opportunities for more innovative applications of biomass in the future bioeconomy. It is thus highly relevant to reaching the goals of the National Bioeconomy Strategy and the international Sustainable Development Goals (especially SDG 12 on responsible consumption and SDG 2 on zero hunger).
Indicators on dietary change are also classified under social norms. Trends and self-reporting about shifts in food - and especially meat - consumption practices can also provide insights into the German population's willingness to engage in changed behaviours, especially as public awareness of health and environmental impacts related to high consumption increases. Trends currently focus on meat consumption but could be extended to trends in dairy in the future.
A.2 Sustainability and / or comparative evaluation options
It is recommended to include dietary recommendations as reference values within the indicator(s). This would allow the indicator(s) to show the distance between current consumption patterns and recommended intake levels, thereby providing a basis for evaluating dietary trends against established nutritional reference values. Both the German dietary recommendations issued by the German Nutrition Society (DGE; see below) and the Planetary Health Diet (which is healthy for all and within planetary boundaries) from the EAT–Lancet Commission (see below) could be considered. The respective reference values should be clearly distinguished, as the two frameworks differ in their underlying objectives and recommendations.
B.1 Stage of development
It is considered established as it is based on national dietary monitoring – which is based on both statistical monitoring as well as regular consumer surveys and nutrition studies conducted on a continuous basis (see below).
B.2 Data sources
The National Nutrition Monitoring programme [Nationales Ernährungsmonitoring - nemo] from Max Rubner Institute shows what people eat (intake) day-to-day based on data gathered directly from citizens in surveys, interviews and physical health checks: https://www.mri.bund.de/de/humanstudien/laufende-humanstudien/nationales-ernaehrungsmonitoring-nemo/. The "Nationale Verzehrsstudie II" was based on data gathered between 2005 and 2007. The monitoring program was renewed and initial results from an online survey were made available in 2025, with more detailed and comprehensive statistics on adult food consumption expected in 2027. The data distinguishes trends across demographics (such as gender) and focuses on daily intake (what and how much people eat). Future monitoring should consider basing dietary trends on this updated data – when it becomes available and if it is provided regularly. As a minimum, a comparative cross-check to statistics from BLE (see below) should be undertaken.
Federal Ministry of Agriculture, Food and Regional Identity (BMLEH) publishes an annual, "pulse check" report since 2015 on "Germany: How it eats" based on a yearly survey of diets and food purchasing trends of citizens reporting their nutritional practices (https://www.bmleh.de/DE/themen/ernaehrung/ernaehrungsreport-ueberblick.html). It also provides statistics in a more detailed way based on data from the BLE from a different method (see below): https://www.bmel-statistik.de/ernaehrung/tabellen-zu-ernaehrung.
The Federal Office for Agriculture and Food (BLE) calculates the annual supply balance for different types of food. This is a statistical method that looks at domestic food production plus imports and minus exports. For that reason it reflects how much food is available for human consumption at the wholesale level (supply balance sheet), but not how much is eaten daily. To make this comparable to dietary recommendations for the intended indicator, the parts of the food that are inedible (e.g. peels, bones) and also estimates of food wasted need to removed. To estimate food intake from supply balance sheets, the SYMOBIO project applies "food waste share" deduction factors based on international benchmarks (Helander et al. 2021). Notably for meat, the BLE provides its own specialized coefficients to adjust for e.g. bone weights and kitchen waste, so that both total consumption (Verbrauch) and direct consumption (Verzehr) for different meat types (including e.g. beef, pork and poultry) are reported. The data set from 2010 onwards was recalculated retrospectively based on updated co-efficients revised in 2022 as well as new census population data: https://www.ble.de/DE/BZL/Daten-Berichte/Fleisch/fleisch_node.html. For more information on the calculation method see: Dokumentation Versorgungsbilanz Fleisch (https://www.bmel-statistik.de/ernaehrung/versorgungsbilanzen/fleisch/dokumentation-versorgungsbilanz-fleisch).
Dietary recommendations provide specific estimate for a healthy and balanced diet. Two frameworks were applied in the SYMOBIO project. First, recommendations for Germany from the German Nutrition Society (DGE) are available at https://www.dge.de, from Germany's Nutrition strategy at https://www.bmleh.de/DE/themen/ernaehrung/ernaehrungsstrategie/ernaehrungsstrategie.htm and related scientific studies (Schäffer et al. 2024) behind the recommendations at e.g. https://journals.plos.org/plosone/article?id=10.1371/journal.pone.0313347. Second, recommendations for the Planetary Health Diet (Willett et al.), which meets the nutritional requirements of all balanced with environmental sustainability, stem from sources like the EAT-Lancet Commission (a group of global scientists creating guidelines for healthy human diets and sustainable food production): https://eatforum.org/eat-lancet/. A comparison is provided by DGE (2024) in their "Guide for the use of the DGE's food-based dietary guidelines in research".
B.3 Coverage over time and replicability
Data is available on an annual basis with e.g. a new calculation method from BLE (see above) from 2010 to 2025. Reporting from BMLEH (see above) is also annual since 2015. The dietary recommendations are updated intermittently and require research to evaluate, especially as regards the Planetary Health Diet. Reproducibility of the derived indicator(s) also depends on documenting the underlying data versions, adjustment factors and dietary reference values used in the calculations.
B.4 Coverage across scales and sectors; compatibility
Detailed breakdowns across food categories are available. In addition, EU (in the context of EU Bioeconomy Monitoring) and international (e.g. FAOSTAT Food Balance Scheets ) reporting provide comparable indicators, such as "Daily calorie supply per capita by source". International and EU indicators may not be directly comparable with detailed German dietary-survey data from e.g. BMLEH and the National Nutrition Monitoring, as they are based on different methods (e.g. measuring food supply/availability rather than individual-level consumption). German national surveys provide more detail on food consumption, nutrient intake and population subgroups, while the international datasets provide cross-country comparability. For national bioeconomy monitoring, German data sources are prioritized, recognizing the aim of also monitoring social norms.
C.1 Feasibility: Fit for monitoring
The indicators are considered sufficient as the underlying data sources are well established in other reporting contexts (see above) and thus subject to many years of experience and improvement. This is especially true of reporting on the trends based on BLE and BMLEH data stemming from statistical analysis. However, the comparison to distance-to-recommendations for different food groups requires deriving assumed intake amounts from total consumption balance sheets using food waste reduction factors. These factors should be evaluated against and possibly supplemented by data from Max Rubner Institute, when it becomes available in the future. The dietary recommendations are also based on best available scientific evidence, noting that these are not updated as frequently.
C.2 Institutions
See above with the Max Rubner Institute, BMLEH, BLE, DGE and EAT-Lancet Commission noted.
C.3 Future prospects
The future prospects are high as such data collection and reporting is already well established in other monitoring contexts. The distance to recommendations may require more dedicated computational work as well as review of dietary recommendations and updates at a national and planetary scale. Food waste deduction factors should also be reviewed (see also further comments below).
C.4 Costs, considerations and reproducibility
The costs for replication of existing data are very low as the statistics are already openly available. An annual reporting of trends is suggested to show changes related to meat consumption. More invested work is needed to check and update dietary recommendations and to improve the method to translate between supply balance sheets and intake or to investigate the use of data sources focused on intake (e.g. MRI).
C.5 Potential for automation
High for updating statistical data and consumption trends, but more limited for reviewing and integrating dietary recommendations, particularly those related to the Planetary Health Diet.
C.6 Presentation options and breakdown / sub-indicator needs
Similar to the Bioeconomy Monitoring Report 2024, it is suggested to show 2 charts depicting (1) trends for meat consumption of pork, poultry and beef (similar to that depicted by BLE) and (2) distance-to-recommendations for different food groups compared to current dietary composition.
C.7 Potential for scenario integration
High and has been done in the 2024 Bioeconomy Monitoring Report.
C.8 Interlinkages and alignment with other monitoring activities
High alignment – see the data sources above and mention of e.g. National Nutrition Monitoring as well as EU Bioeconomy Monitoring and FAO monitoring.
SYMOBIO currently derives average German consumption of specific food groups based on "food waste share" deduction factors used by Helander et al. (2021) --which were in turn based on international averages-- noting the uncertainty iterated by Helander. There is a need in the future to check these statistics against reported intake amounts by e.g. the Max Rubner Institute, when estimates are available. In SYMOBIO, a continuation from the data presented in 2024 was prioritized for continuity purposes.
Available online https://www.ble.de/DE/BZL/Daten-Berichte/Fleisch/fleisch_node.html
Available online: https://www.bmel-statistik.de/ernaehrung/tabellen-zu-ernaehrung
DOI: 10.1088/1748-9326/abe673.